
Abstract
Based on my recent Data Analytics & AI conversations with multiple large enterprise customers, irrespective of their stage in BI, Analytics & AI Maturity Journey. There seems to be similar key themes posing challenge in unlocking the strategic value of data for consistent business growth. There are inherent complexities and ground realities in building a data-driven culture to drive business forward in a consistent, forward thinking, agile and informed way. Hence, there is clear emphasis by majority of the Enterprise Customers to focus efforts towards formulating a coherent Data Strategy to achieve desired business outcomes.
Key Themes
If we carefully analyse the above key themes, they do relate to important facets of a coherent Data Strategy and one of the definitions which explains it nicely:
“A data strategy is the foundation to leveraging data as an asset and driving business forward. It’s not a patch job for data problems. It’s a long-term, guiding plan that defines the people, processes, and technology to put in place to solve data challenges.”
However, understandably putting a Data Strategy is an exercise which could be daunting and long enduring process, there are plenty of great blog posts / whitepapers already available in terms of how to build a Data Strategy and once such example is 3 part blog series on how to build & execute Data Strategy (This can be used as a Reference point for acquiring further details on individual topic areas). Creating a strategy is one thing but to execute one on enterprise scale poses a great challenge to organisation’s existing culture, people, processes, and technology choices. It requires a great deal of commitment and clearer ownership at all levels of an organisation. This is reflective in quite a few examples that even having commitment from the top-level leadership, still the process of demonstrating value isn’t as agile as it should be.
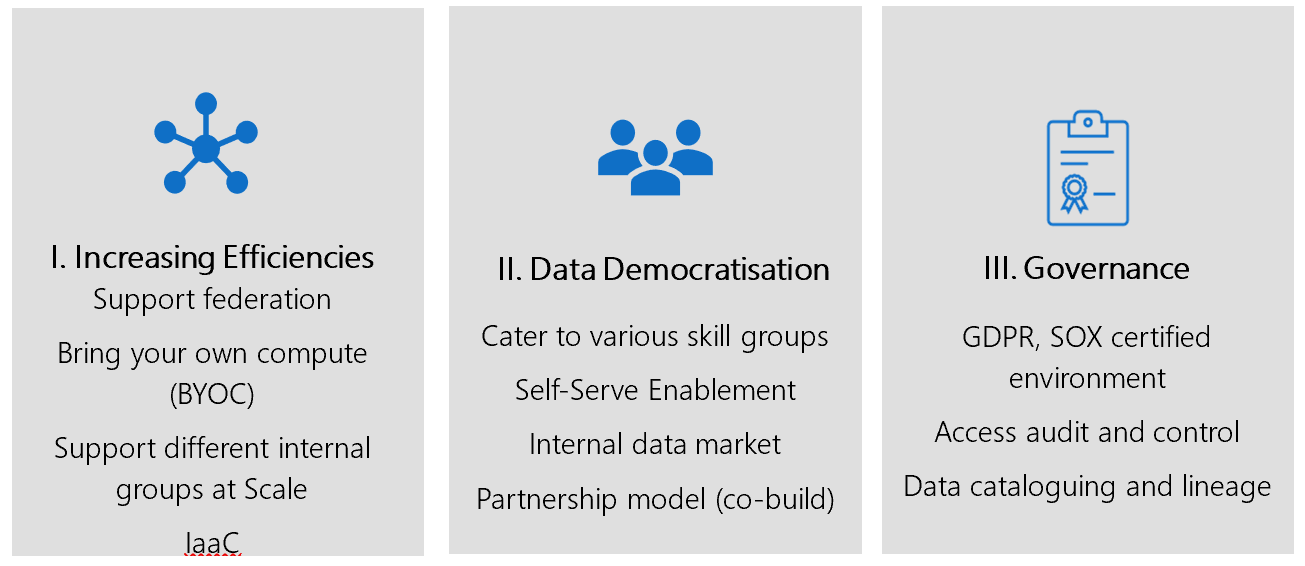
Let’s take a quick look at the strategic principles and why they are so important in the current context of things:
Increasing Efficiencies
Formulation of Data Strategy could take longer to execute and with COVID-19 the business challenges have increased tremendously, more than ever before it has imposed the need for organisations to adapt quickly and bringing efficiencies in all areas of business. According to the report by Gartner on emerging risks, while organizations continue to focus on digital initiatives and invest in them, two-thirds not only fail to deliver upon expectations, but also demonstrate enterprise weaknesses.
Data Democratisation
Central IT has slowly been shifting to shadow IT becoming more de-centralised ( to know more there is a detailed blog about Centralised vs De-Centralised Data Architecture approach) and that’s what has led to the resurgence of Data Mesh concept as well. They want to innovate quickly by having access to enterprise-wide unified quality data in self-serve fashion, in order to meet challenging & timely business requirements. There are many reasons why businesses fail to tap into the full potential of their data – business functions working in separate silos, each team using different tools & standards for data analysis, or a failure to link KPIs to overall business goals.
Data Democratisation is the key to delivering that value back to business and achieving the challenging business growth targets.
Governance
In relation to Data Governance there must be a right balance in the decentralised world of data democratisation approach. If governance is enforced too hard that could possibly stifle innovation but at the same not having some core principles & processes in place could also endanger creating “Data Wild West”. Resulting in damaging organisations reputation and potential revenues. So, a holistic Data Governance approach is fundamental to unlocking strategic value of data in a consistent manner.
Here is a nice blog to understand as how to build an effective Modern Data Governance Strategy
In the absence of a well thought-out Data Strategy for organisations (not applicable in all cases) and mounting pressures of delivering key insights in timely manner, there is a clear need to just “get going” and quickly start demonstrating value back to business. In this pursuit, acting on the above Key themes or using them as strategic principles wrapped in a framework could not only lead to addressing current business problems but even assist in the formation of future holistic data strategy in an iterative way with validation (not tactical or throw away exercise), yet yielding quick timely results. This seems to be the need of the hour and it’s reflective of the current rapidly changing business environment.
Solution
This write-up is aimed to provide a clear and pragmatic guide for business & technology leaders to help develop the mindset and strategies required to generate value from data and scale quickly in a simplified structured manner.
Iterative Data Strategy Validation Framework

1- Business Aligned Objectives
Identifying key priorities in line with business vision and keeping “Think big, start small, and act fast” ideology is the fundamental key for success. Picking up the right use case(s) doesn’t always need to be long haul difficult vetting process, it could be an on-going problem in any business unit where there is enough data to validate its ROI, more appetite and easy buy-in. So, there is no analysis paralysis enigma and things can move quickly, as that’s where most of the organisation could be struggling to get started.
Otherwise, there are other approaches to validate your key business priorities against technical capabilities holistically also e.g.
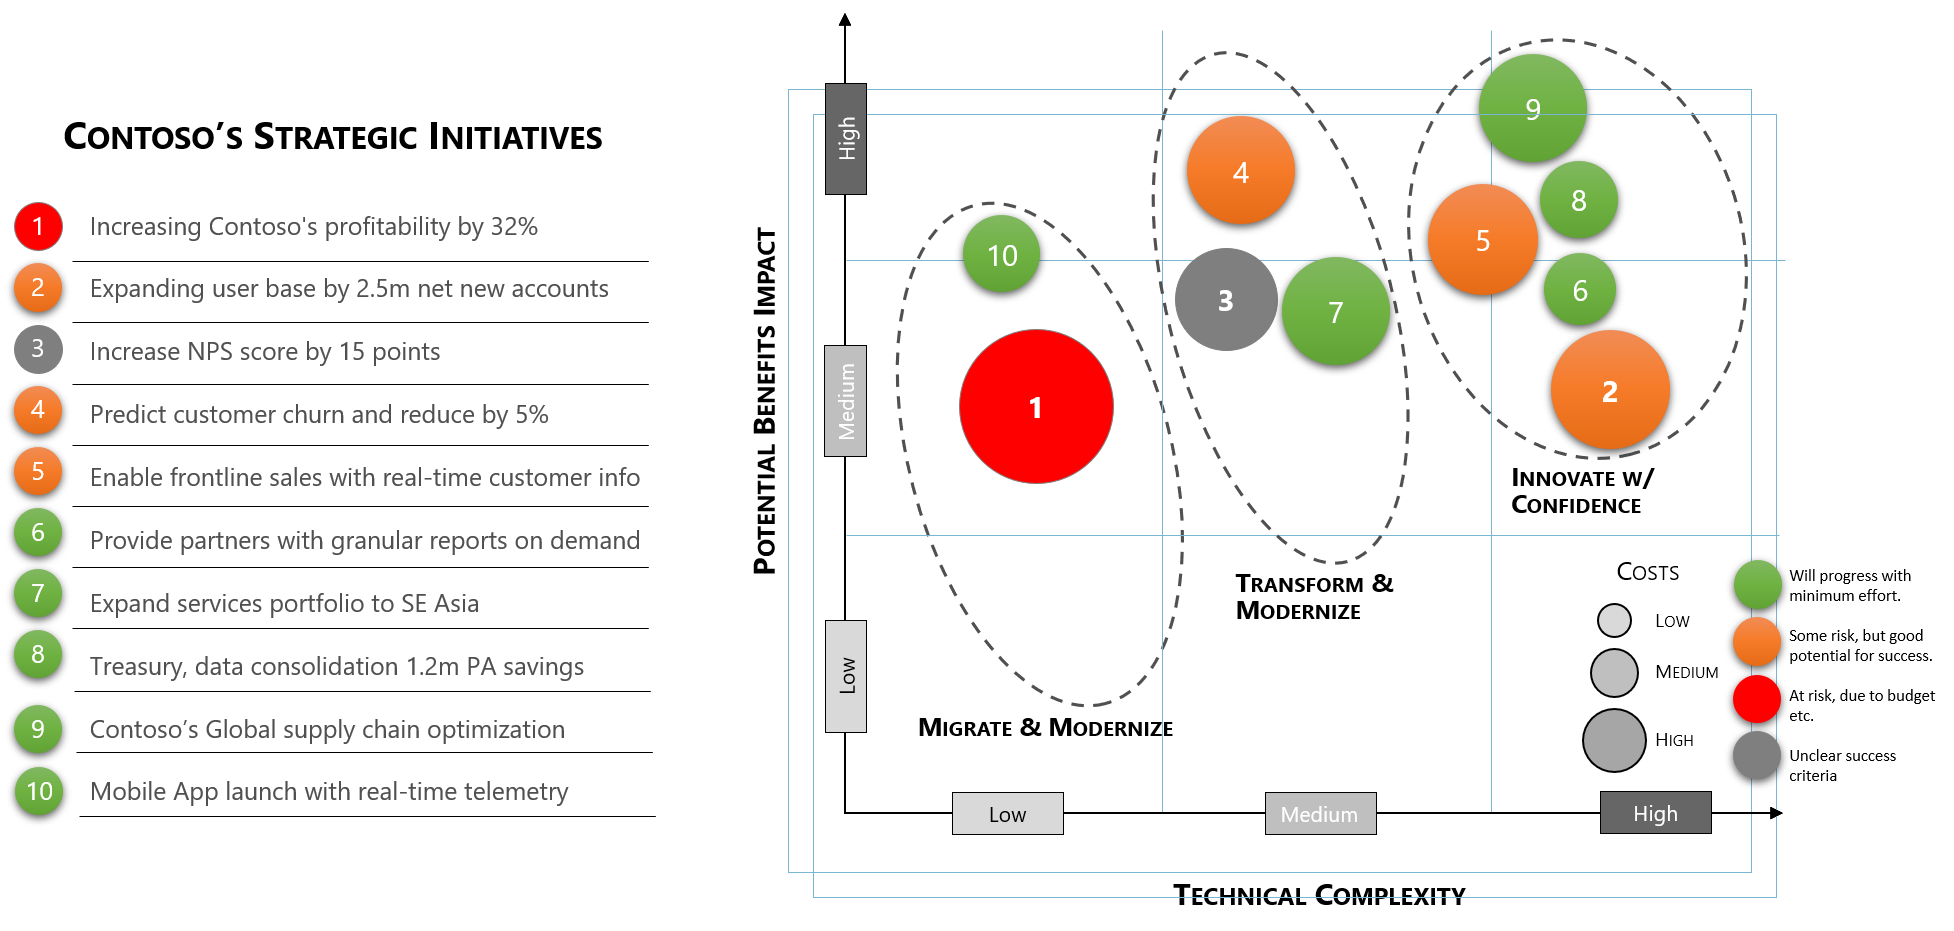
Aligning strategic business priorities with technical complexities
For further Details: how-to-build-and-deliver-an-effective-data-strategy-part-1
2 – Commitment
There has to be clear understanding around the adopted approach and desired common business objectives among all the key roles involved in making this a success i.e. Leadership Team (C – Level), Business Unit, IT, Ops etc.
3 – Capability & Skills
Clearly mapping out the Product, Services or Tools capabilities Maturity Assessment along with People skills, who will help deliver on the achieving the overall objectives.
The above is not an exhaustive list by any means and could vary depending on the organisation type/structure.
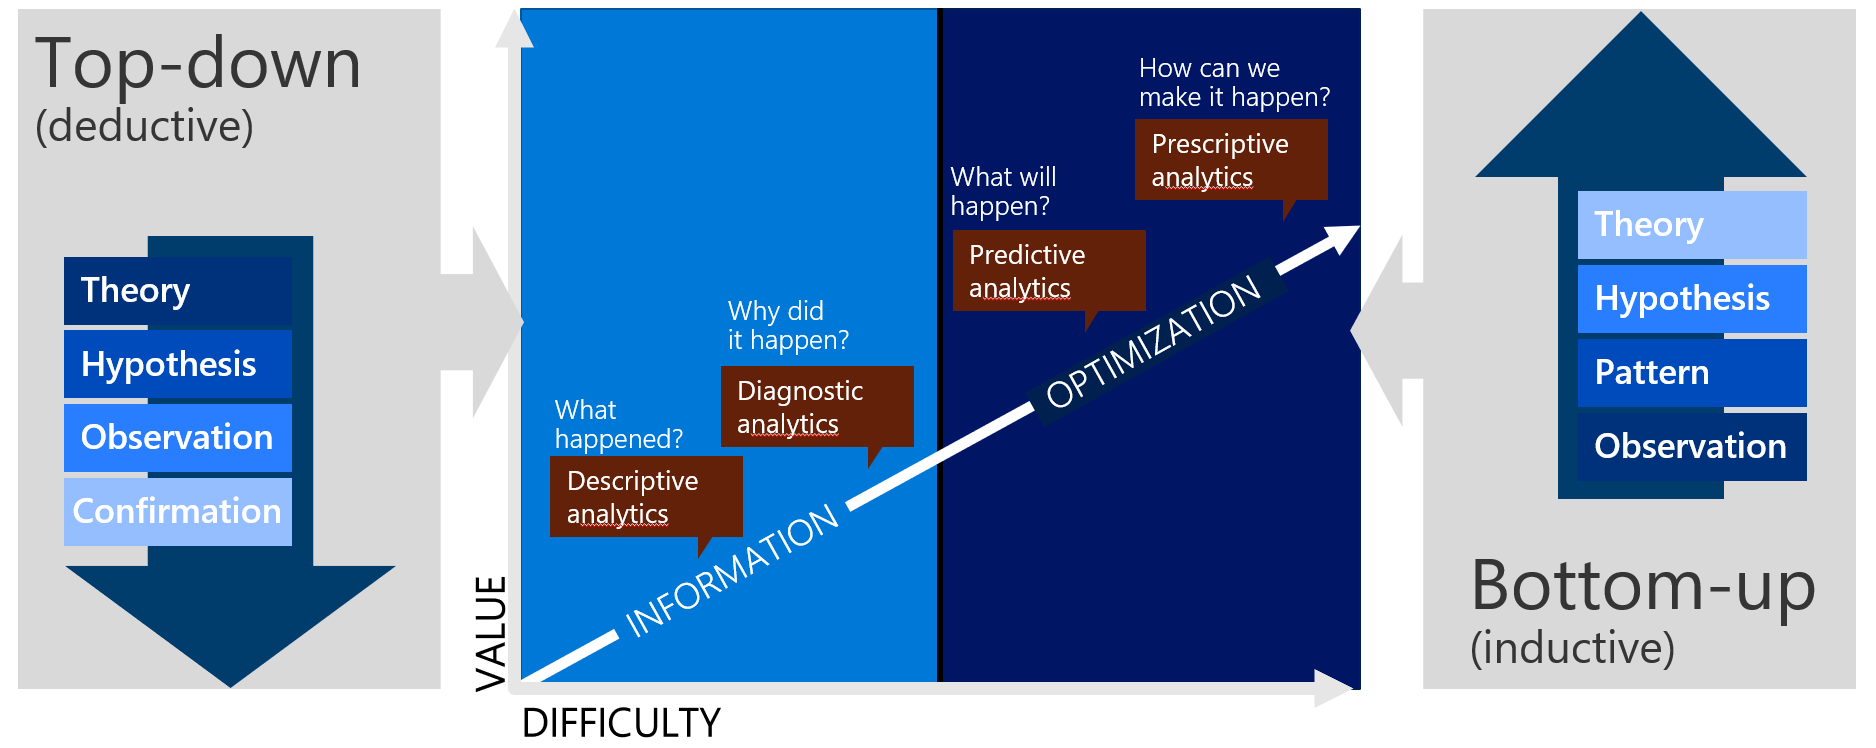
4 – Assess Capability Maturity
There must be an exercise in assessing the Data Analytics & AI capabilities required to deliver on a specific use case, holistically or at an organisational level. However, there has to be some guiding principles/process to go about the assessment:
- Define current capabilities and ambition
- Identify risks and blockers to progress
- Clearly state benefits and key stakeholders
- Link benefits to stated business objectives
- Identify key dependencies
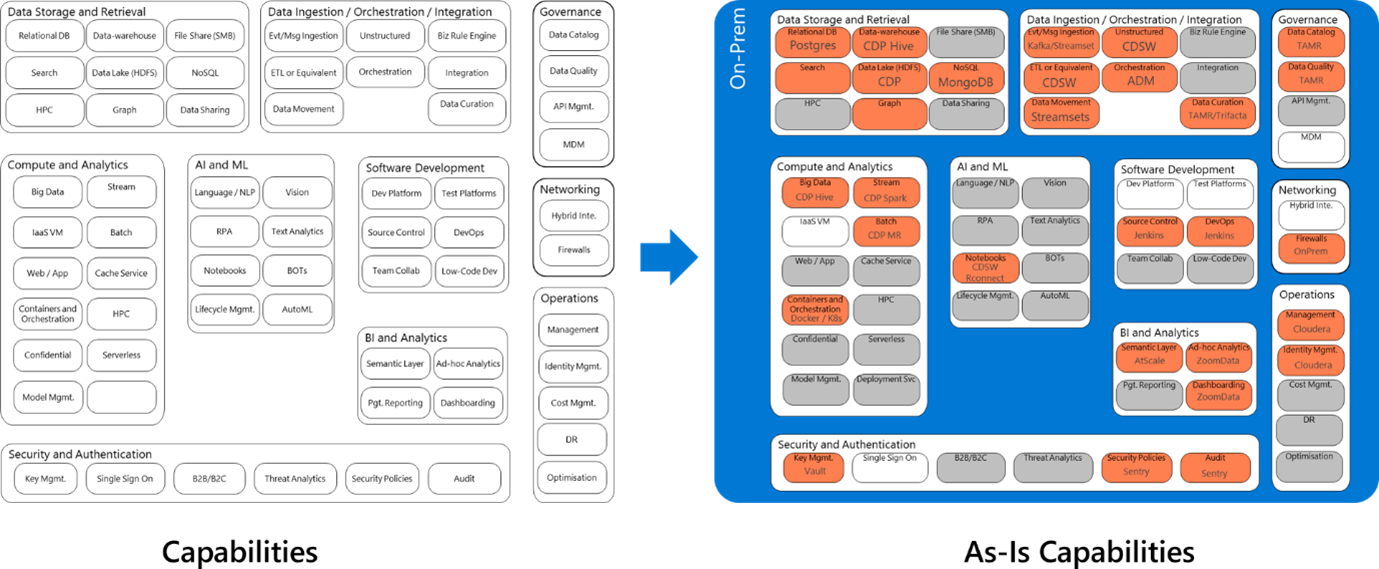
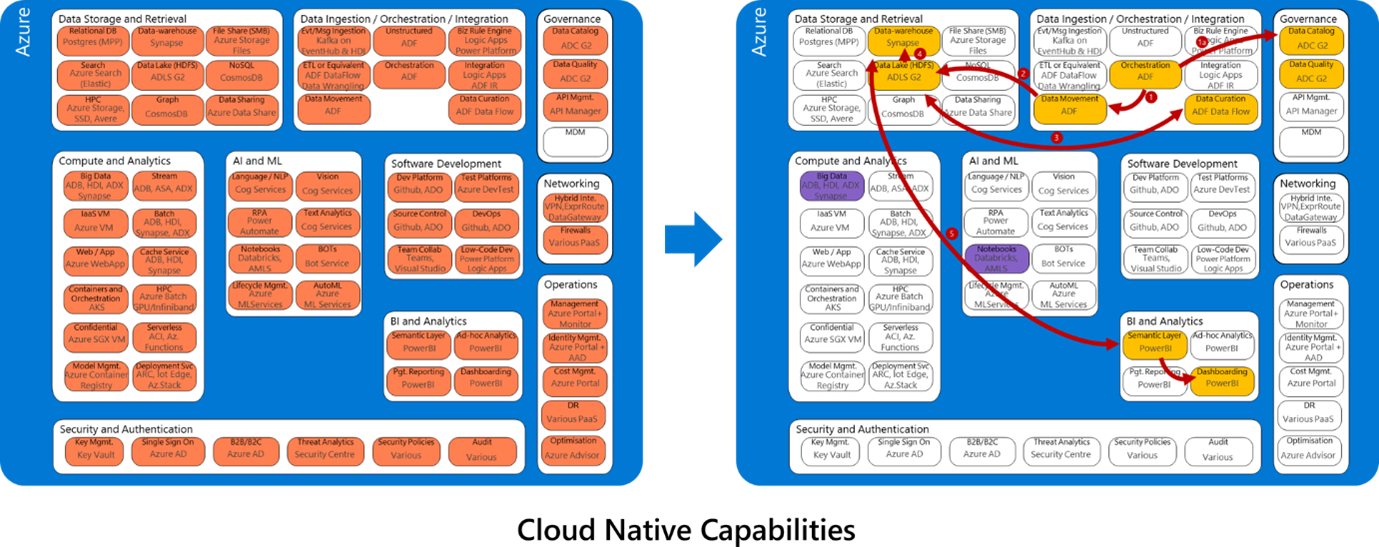
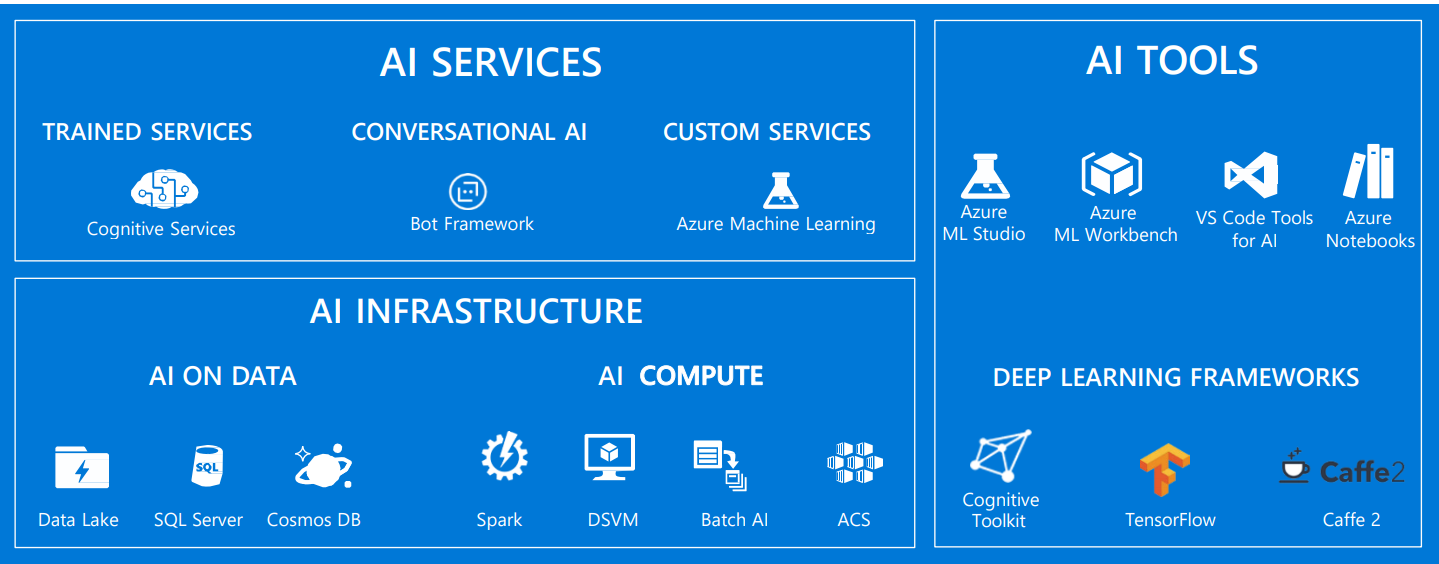
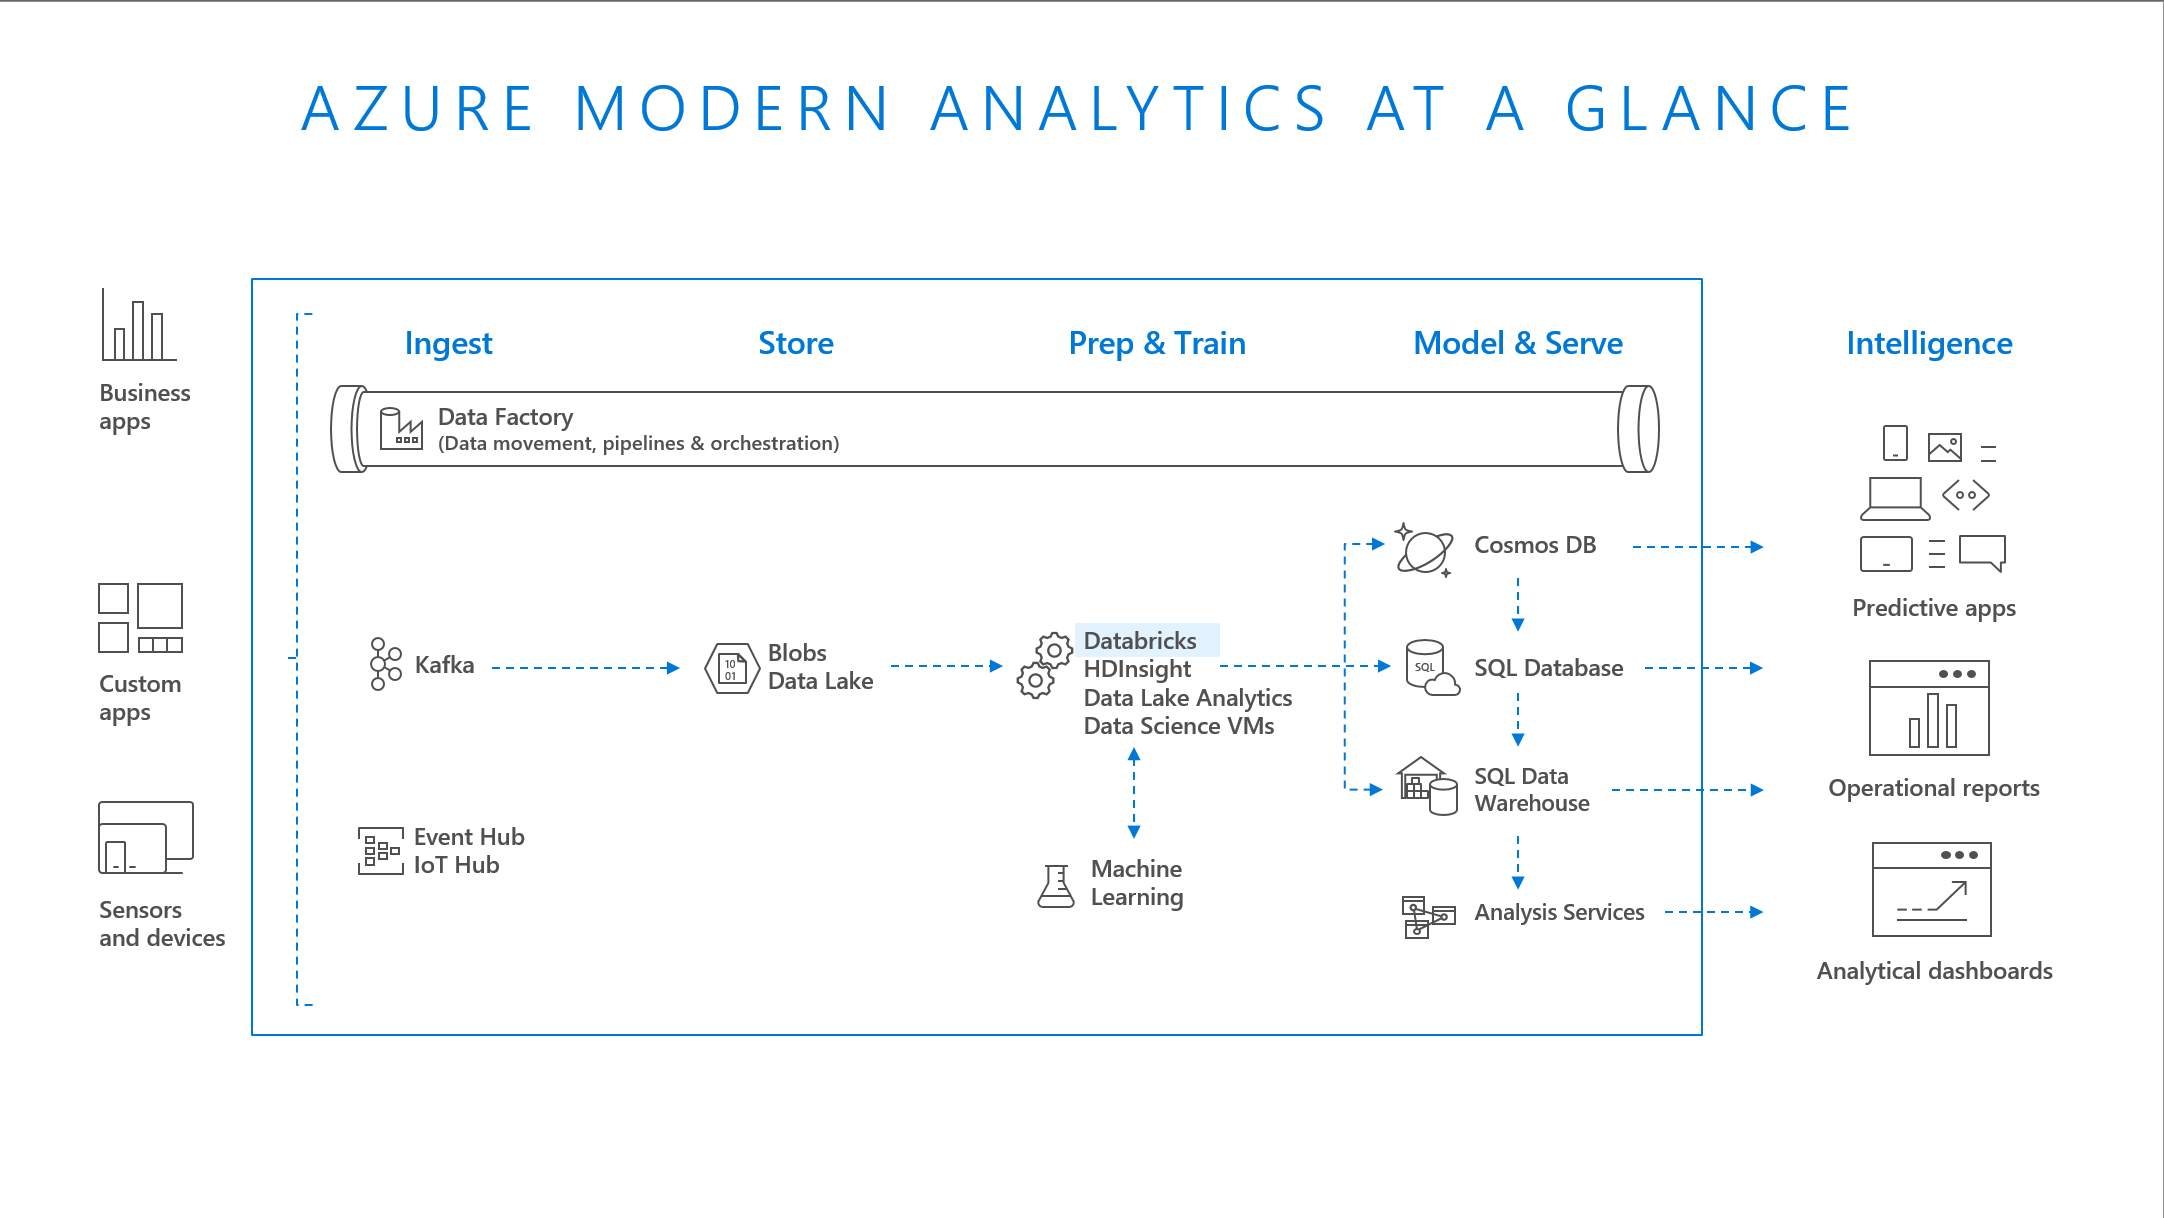
As a next step, look at Azure native services, and start mapping what you need to deliver success.
Along with capability Maturity Assessment, Culture is also another important aspect which is the key focus of this framework to make it successful.
The details are covered here: how-to-build-and-deliver-an-effective-data-strategy-part-2
5 – Communication
Communication being one of the most important elements of this framework and requires communication process to be devised between Leadership, Business, IT & Delivery Teams.
As this would not only assist in delivering effectively in the context of current project but establishing a forum to stay in line, up-to date and focused on the overall objective of formulating a Holistic Data Strategy for future.
There are couple of key strategic processes which would help in delivering successfully in the context of this framework:
- Formation of CoE
- Adopting Agile Delivery Method
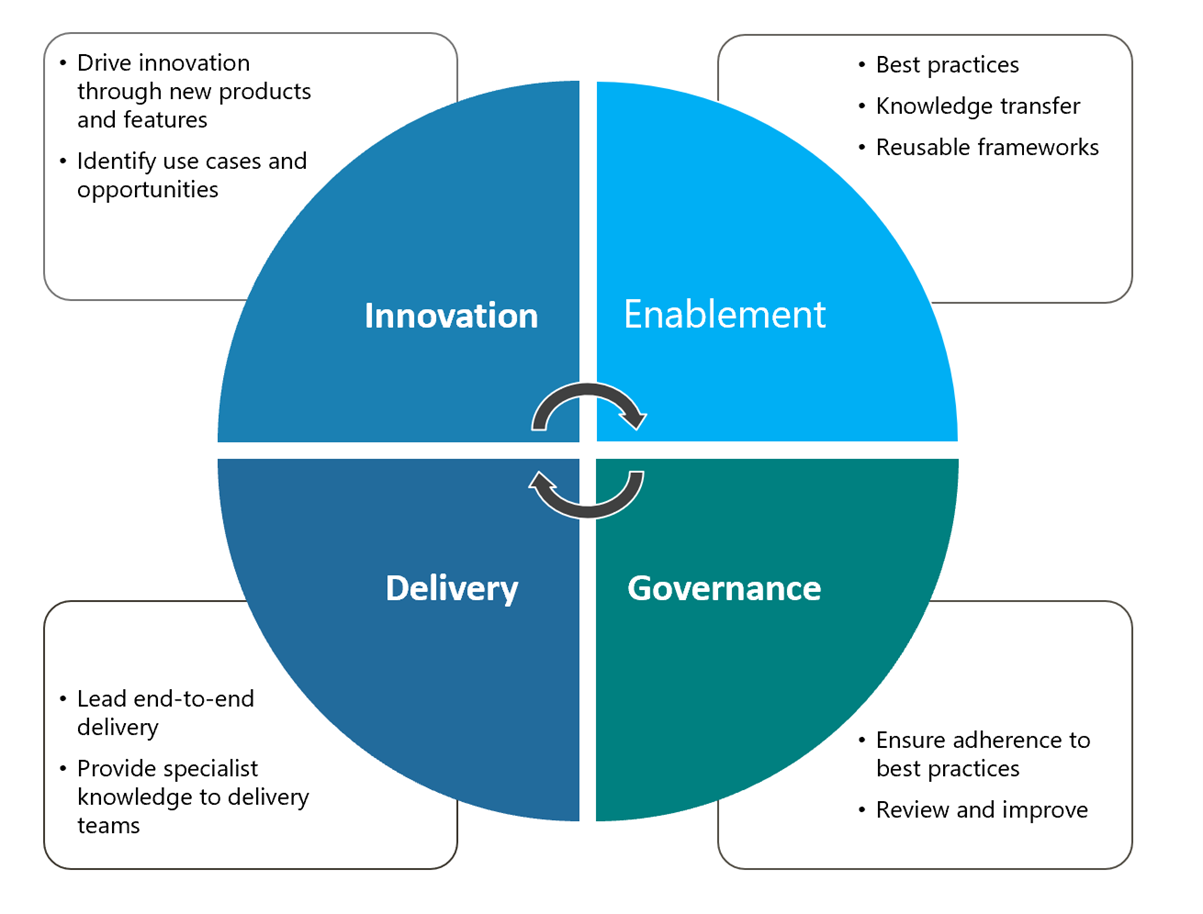
Formation of CoE
Centre of Excellence would assist in:
- A Centre of Excellence helps drive adoption, Standards, best practices and innovation
- Funded team for full delivery and specialist skills provision
- Deep technical skills in key technologies
- Active participation and evangelising in Communities of Practice
Adopting Agile Delivery Method
Agile is the ability to create and respond to change. It is a way of dealing with, and ultimately succeeding in, an uncertain and turbulent environment.
It’s about thinking through how you can understand what’s going on in the environment that you’re in today, identify what uncertainty you’re facing, and figure out how you can adapt to that as you go along.
For further details on benefits, manifesto and why adopt please see: agilealliance.org
Some of the agile processes for BI, Analytics & AI are referenced below:
6 – Reference Architecture OR Technology Solution
This is another area where customers seek clarity or prescriptive guidance before starting to carve out the technical details for a specific use case, project or an End-to-End Data Analytics & AI platform. This can be a stumbling block as how to ensure that all the strategic principles not only in the scope of current use case but also required for the formulation of the overall Data Strategy are considered.
So, keeping this challenge in view and speed up the delivery of end-to-end insights journey, Microsoft has developed a prescriptive offering in the context of an Enterprise Scale Analytics which marries up perfectly to the key themes discussed above.
“Caution: It’s going through initial feedback and prescriptive guidance is in Private Preview – Subject to change”
Having said that, not necessarily this is the only architectural approach to fully benefit using the above framework, in fact it’s totally down to each organisation’s preferred Cloud provider, Skills & Technological choices.
Enterprise Scale Analytics & AI
Enterprise scale Analytics & AI is part of Microsoft’s Cloud Adoption Framework and designed to enable customers building enterprise data platform which provides prescriptive guidance, coupled with best practices, on cloud operating model, reference architecture and platform templates based on real-world learnings from some of our most challenging, sophisticated, and complex environments.
Additionally,
- Supports multiple topologies ranging across Data Centric, Lakehouse, Data Fabric and Data Mesh.
- Based on inputs from a diverse international group of specialists working with a range of customers.
- Separate guidance tailored to Small-Medium and Large enterprises.
- ~80% prescribed viewpoint with 20% client customisation
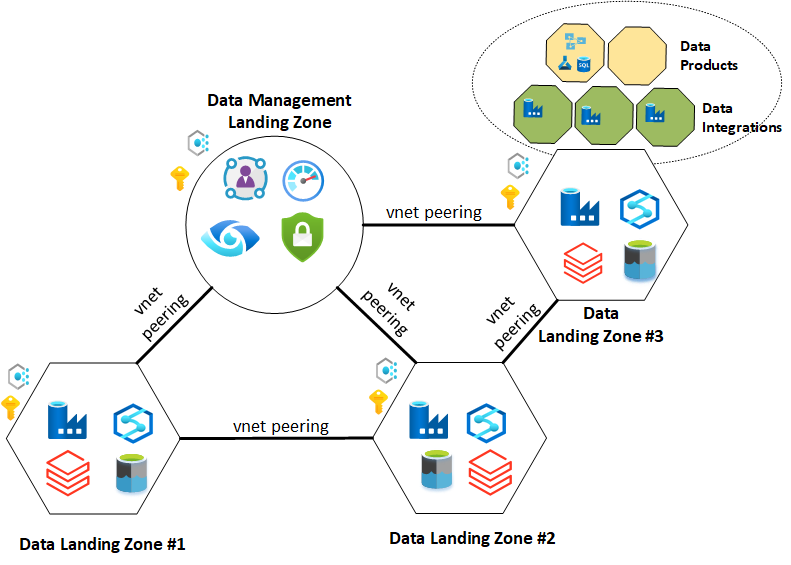
For further details: Enterprise-Scale-Analytics Overview
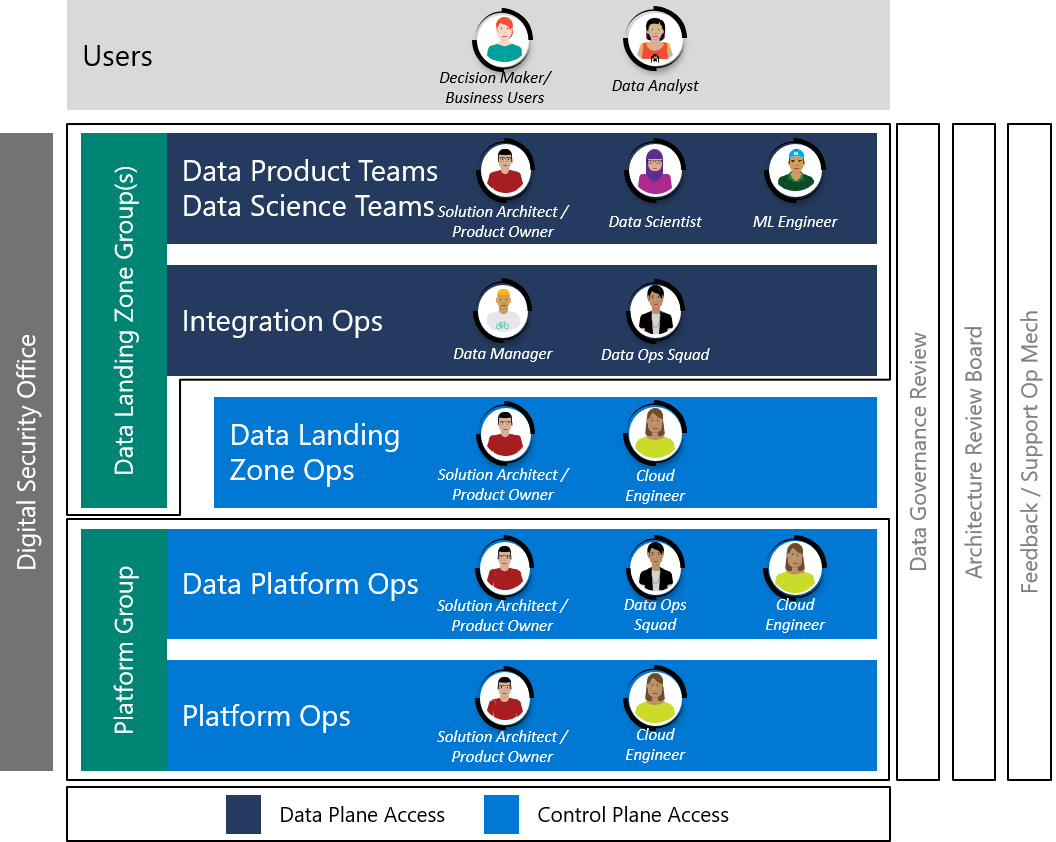
7 – Data Product Delivery Ops Model
To deliver effectively the Enterprise Scale Analytics and AI moves teams from working horizontally across each tier such as Ingest, Processing, Analysis, Consumption and Visualization to vertical Data Landing Zone Groups coexisting together in an agile team.
8 – Deliver Value
Finally, Data product delivery against the set-out success criteria specified in above “Business Aligned Objectives” section is going to validate the above iterative framework. Additionally, taking the learning and continuously innovating will help in building business confidence and widening out of the Data Strategy strategic goals, for clearer and quicker adoption across business.
Summary
Hope the above Iterative Data Strategy Framework provided some insights or pointers in the case of organisations either starting to build a new Data Strategy or looking to refresh an existing one, in the light of changing business environment / objectives. The above approach is built around unlocking Data’s strategic value in an agile iterative way, contributing towards building a data driven culture.

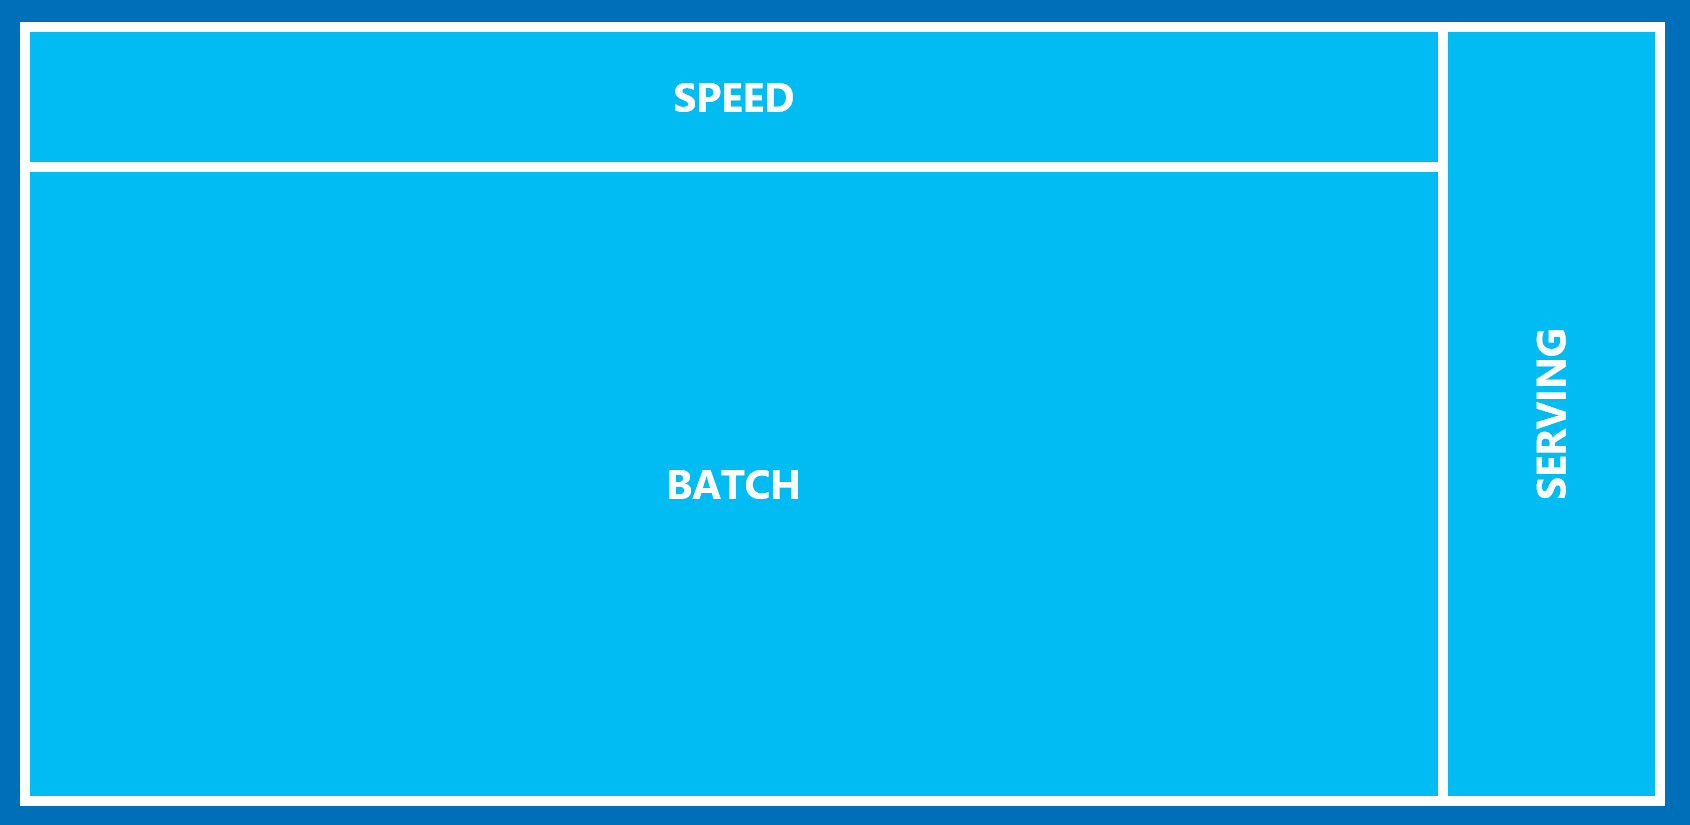


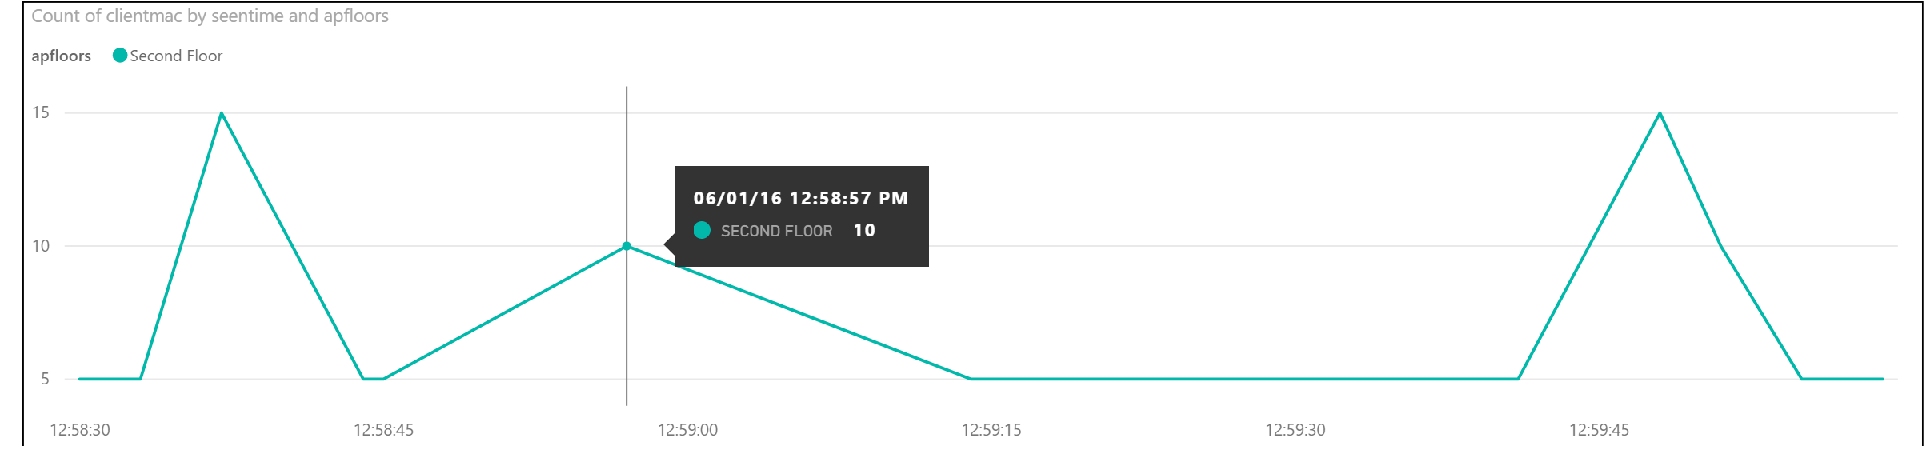
 The general workflow is as follows:
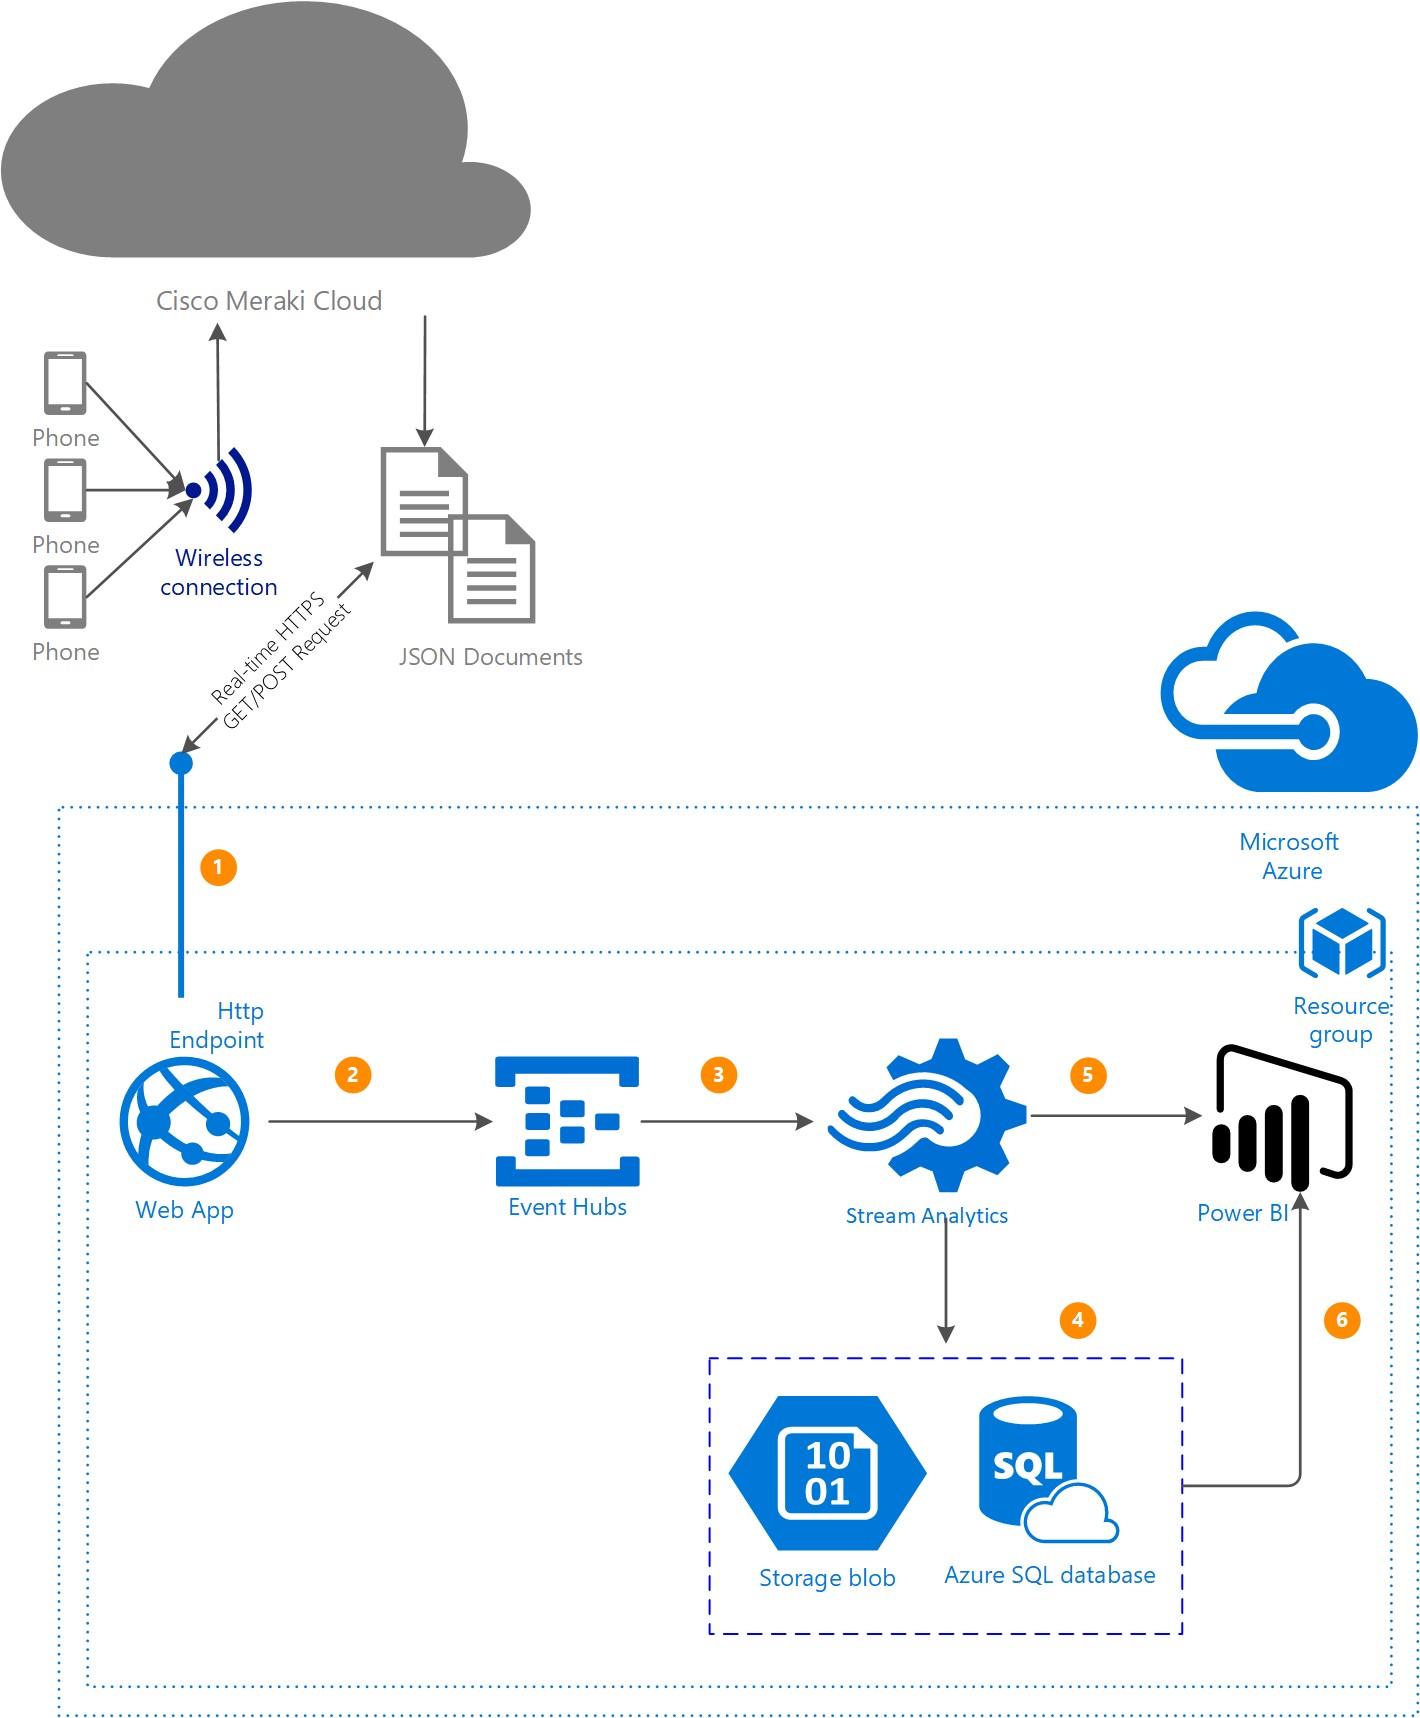
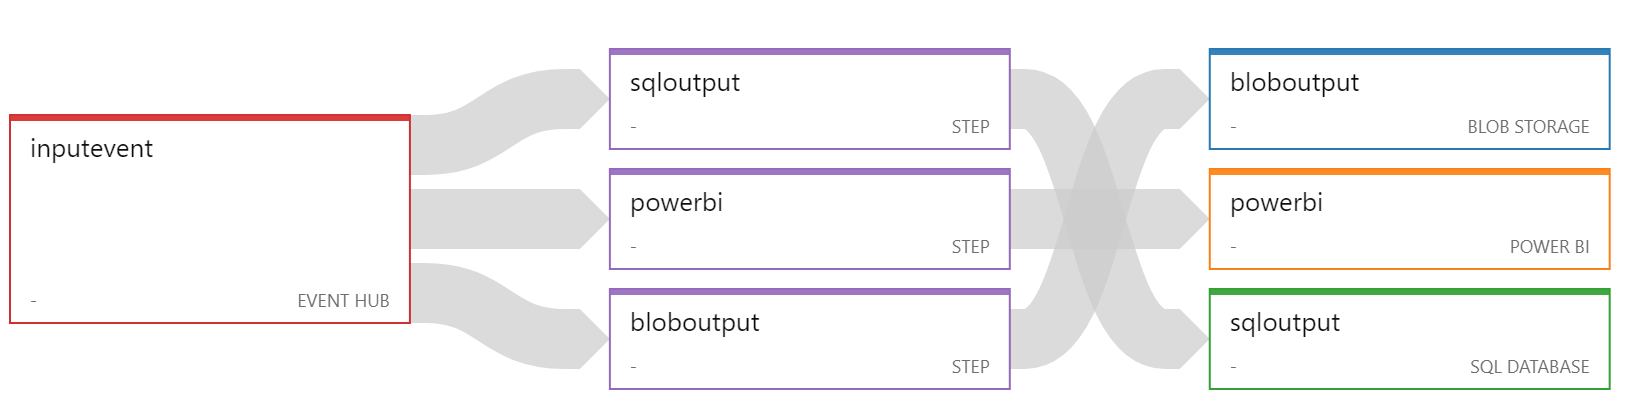 Stream Analytics workflow
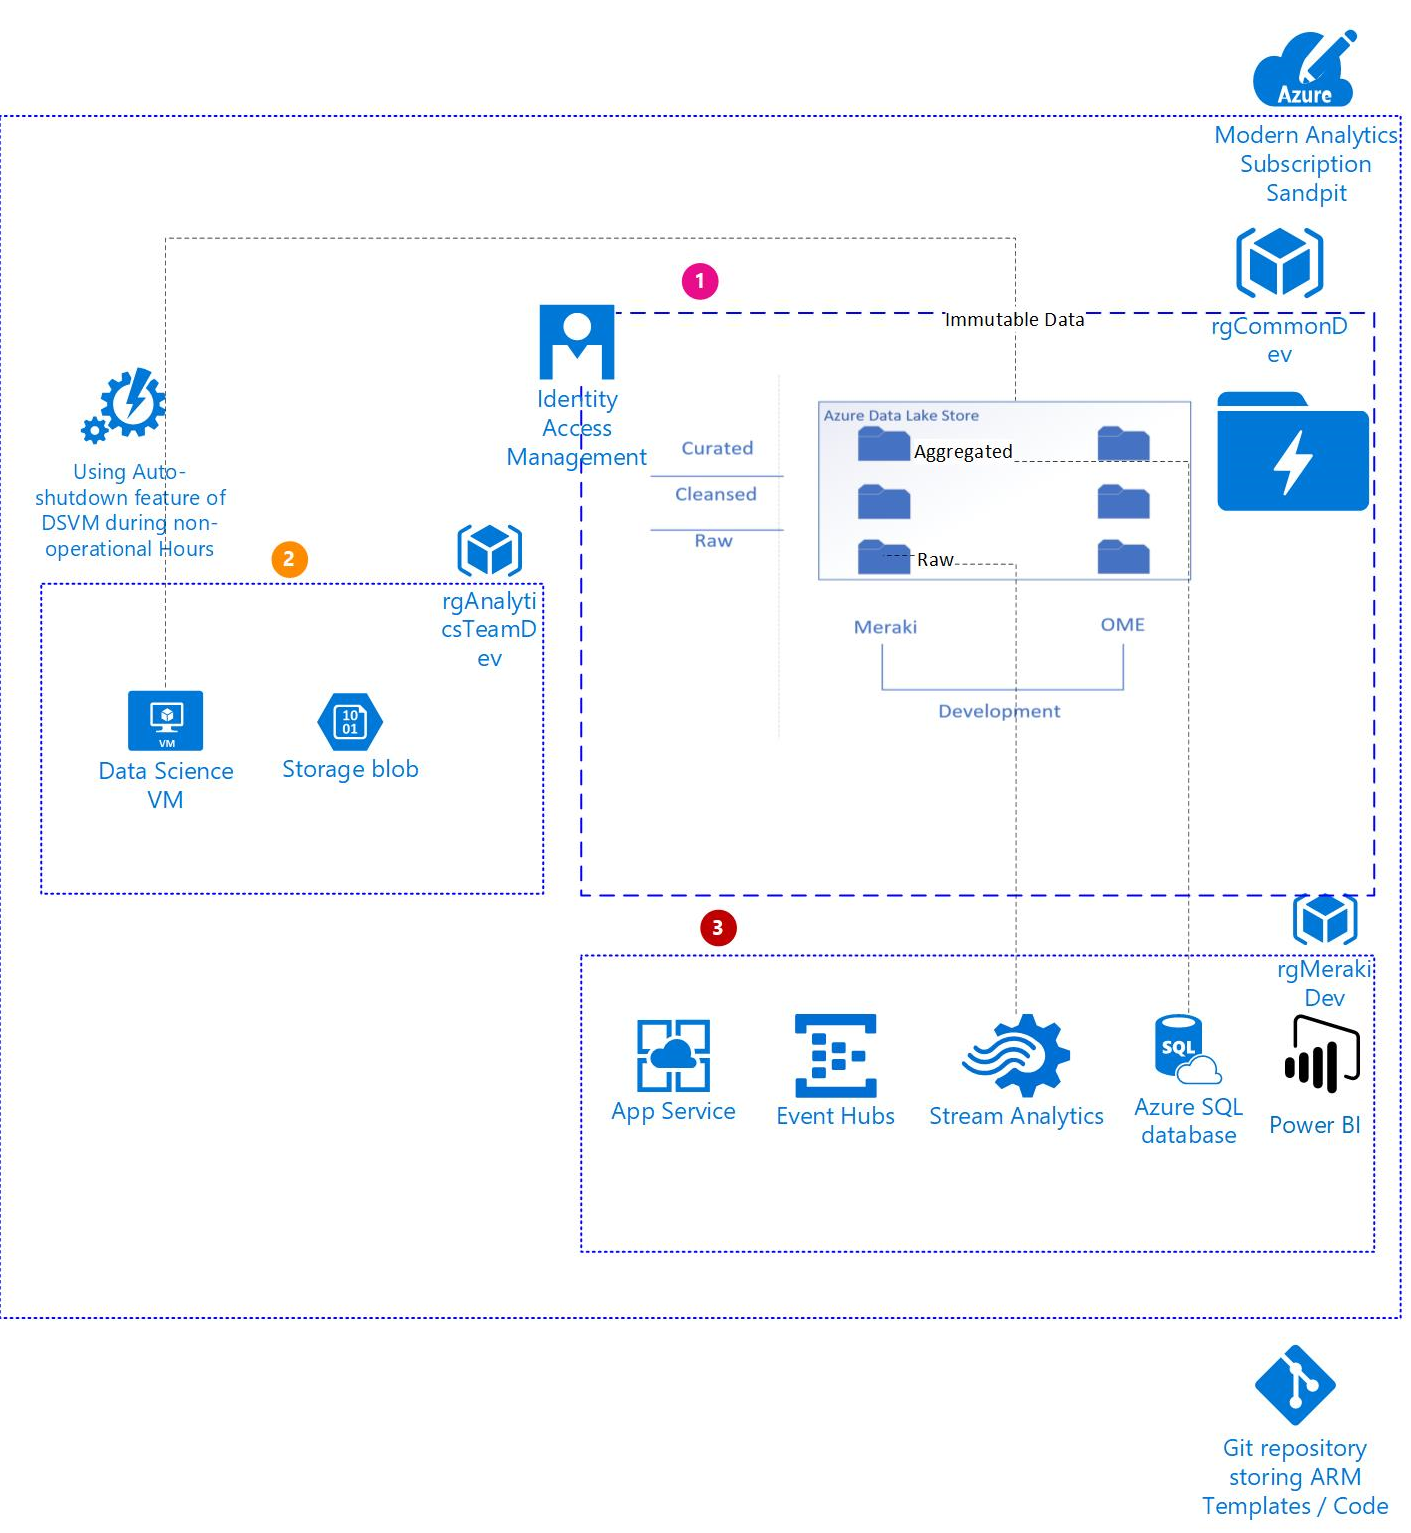
 Example guidance